


Measure What Matters. Optimize Team Performance.


Flying Blind Without Performance Data Hurts Your Support Team
Without clear visibility into agent performance, support managers struggle to identify bottlenecks, coach effectively, or prove team value. Are response times slipping? Which agents need support? What's causing resolution delays?
Performance Metrics That Drive Results
FCR
First Contact Resolution
The percentage of resolved tickets where an agent solves a customer's issue with only one reply.
Speed
Average First Response Time
The average time taken by agents to send the first response to a ticket.
Efficiency
Average Time to Closure
The average time taken by agents to move a ticket to a completed status.
Performance Insights That Help You Lead Smarter
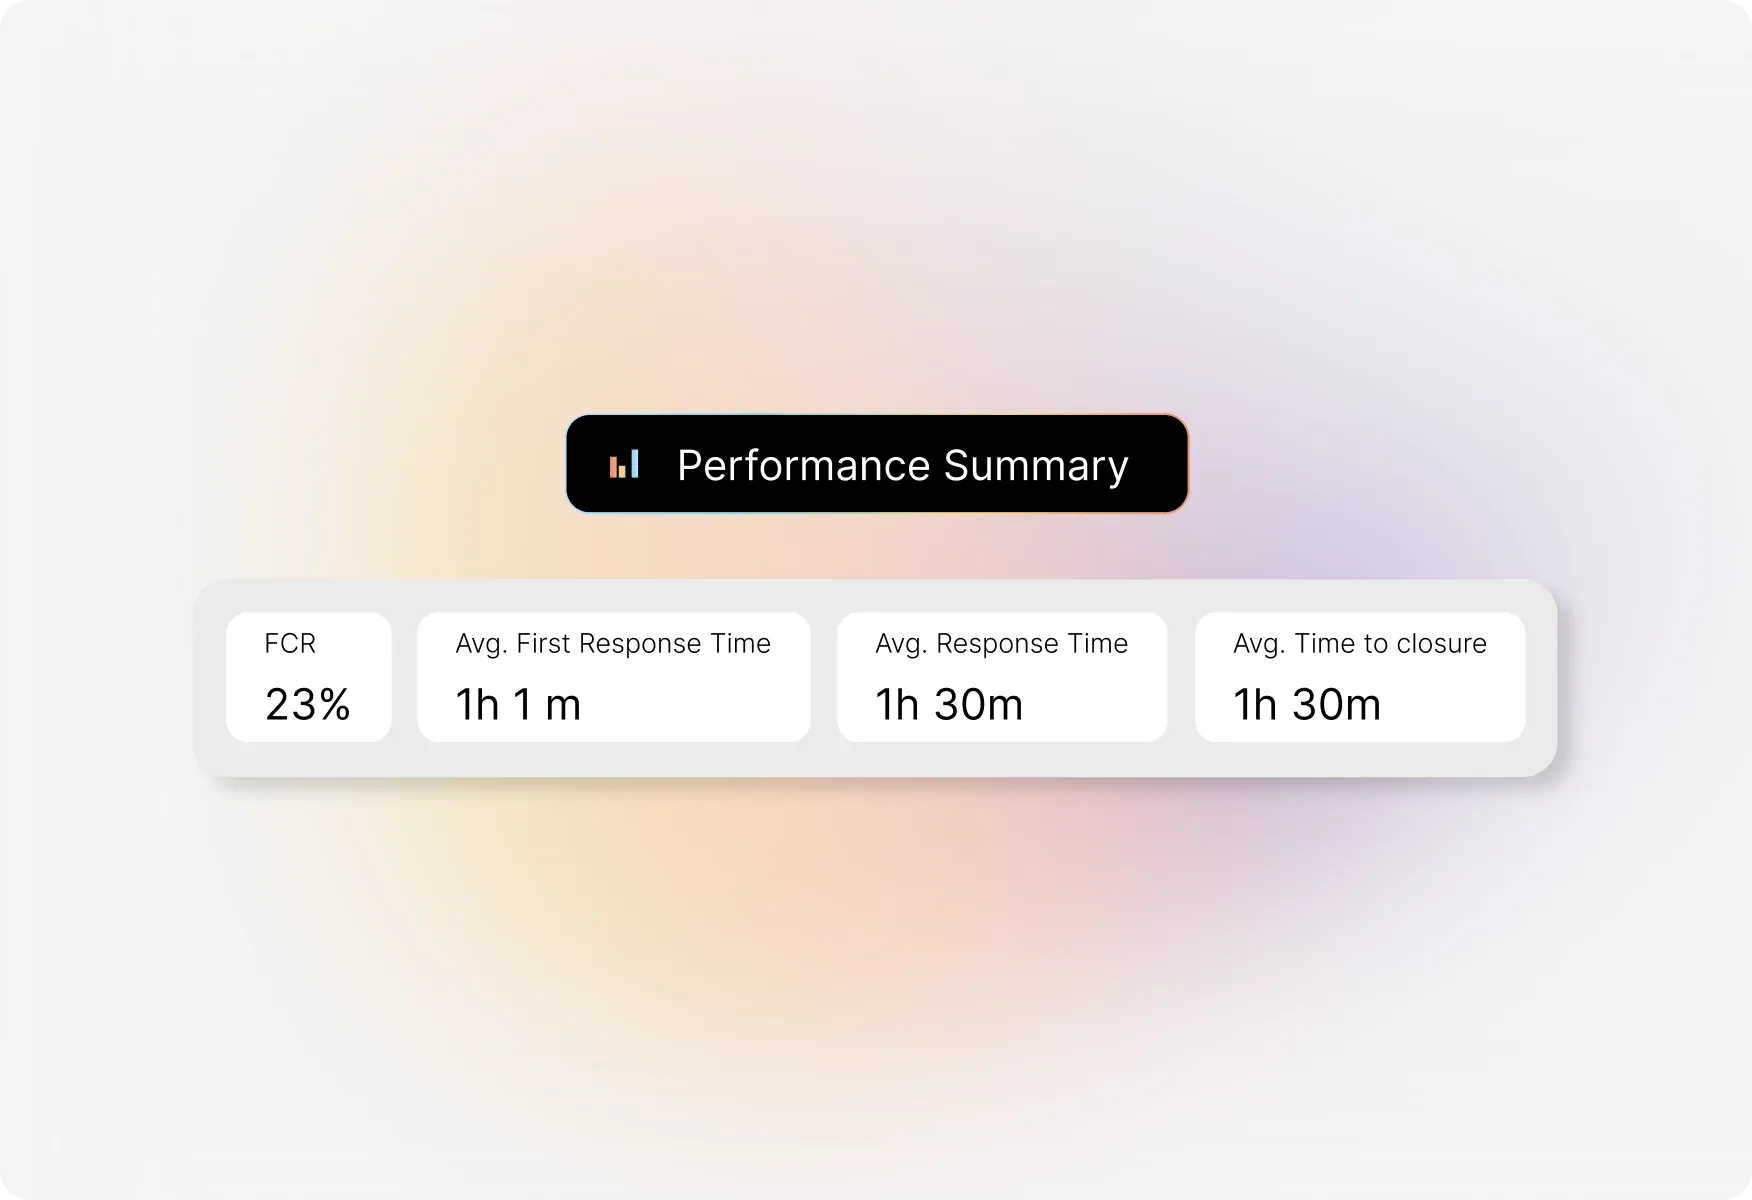
Get the Big Picture Instantly
Summary Pane - Your Performance at a Glance
The Summary Pane gives you a quick overview of your help desk's overall performance statistics. See FCR rates, average first response time, average response time, and average time to closure—all calculated based on your selected categories and time range.
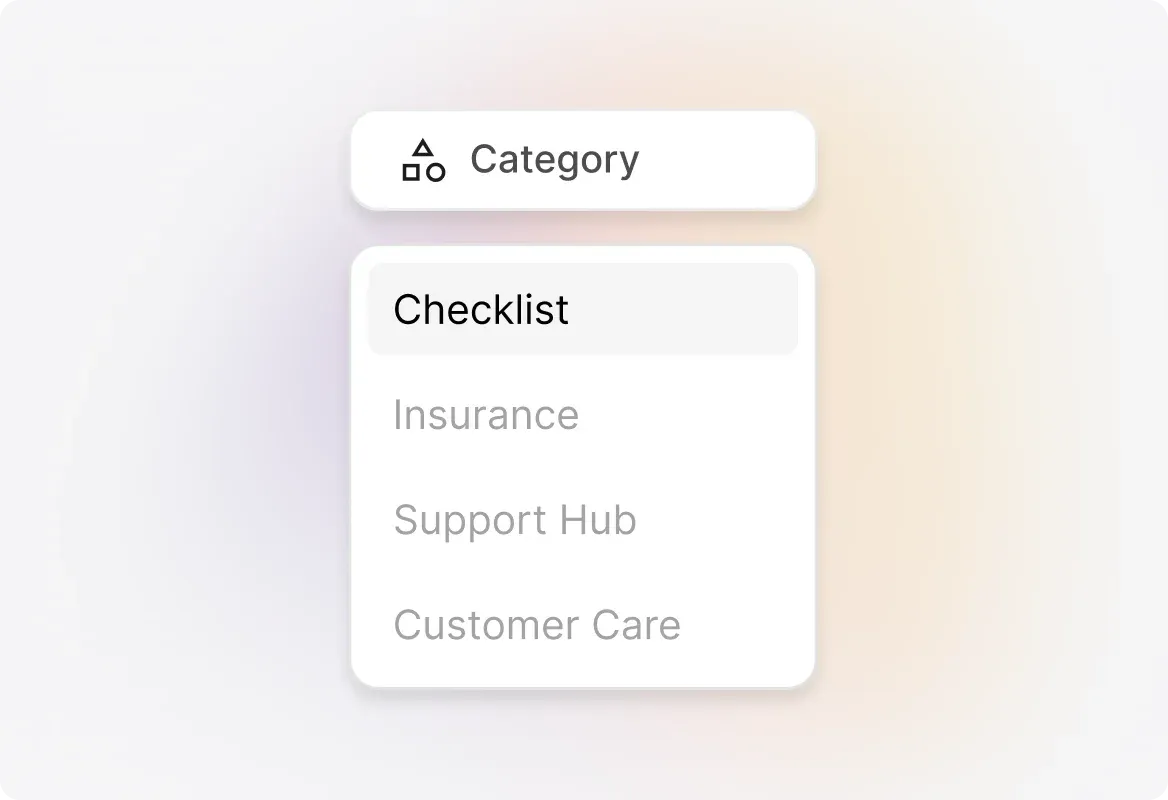
Understand How Each Category Performs
Performance by Category
Get a quick overview of how different ticket categories stack up across key performance metrics. Toggle between FCR, average response time, average first response time, average responses to closure, and average time to closure to spot trends and identify areas for improvement.
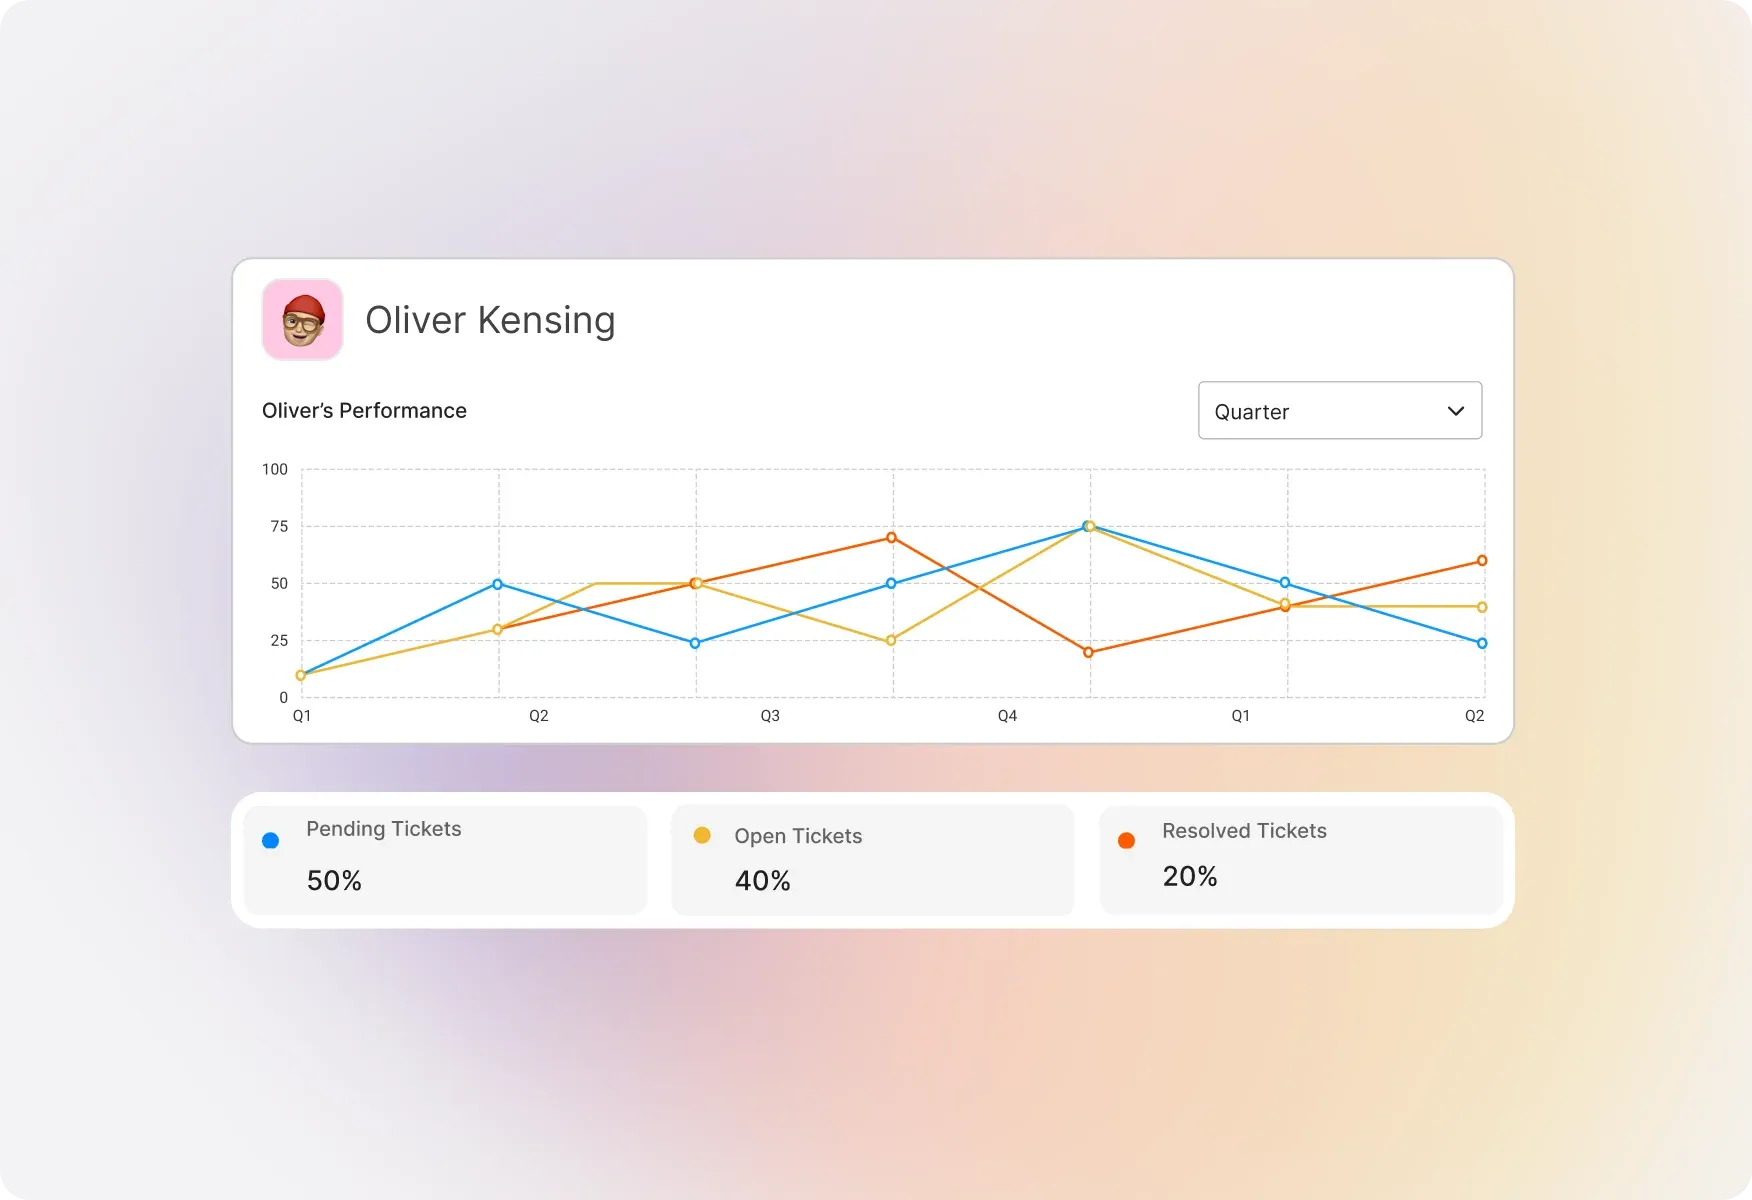
Track Individual Agent Performance
Performance by Agent
See how each agent performs across all key metrics. Use the dropdown to toggle between FCR, response times, and closure metrics to identify top performers and agents who may need additional coaching or support.
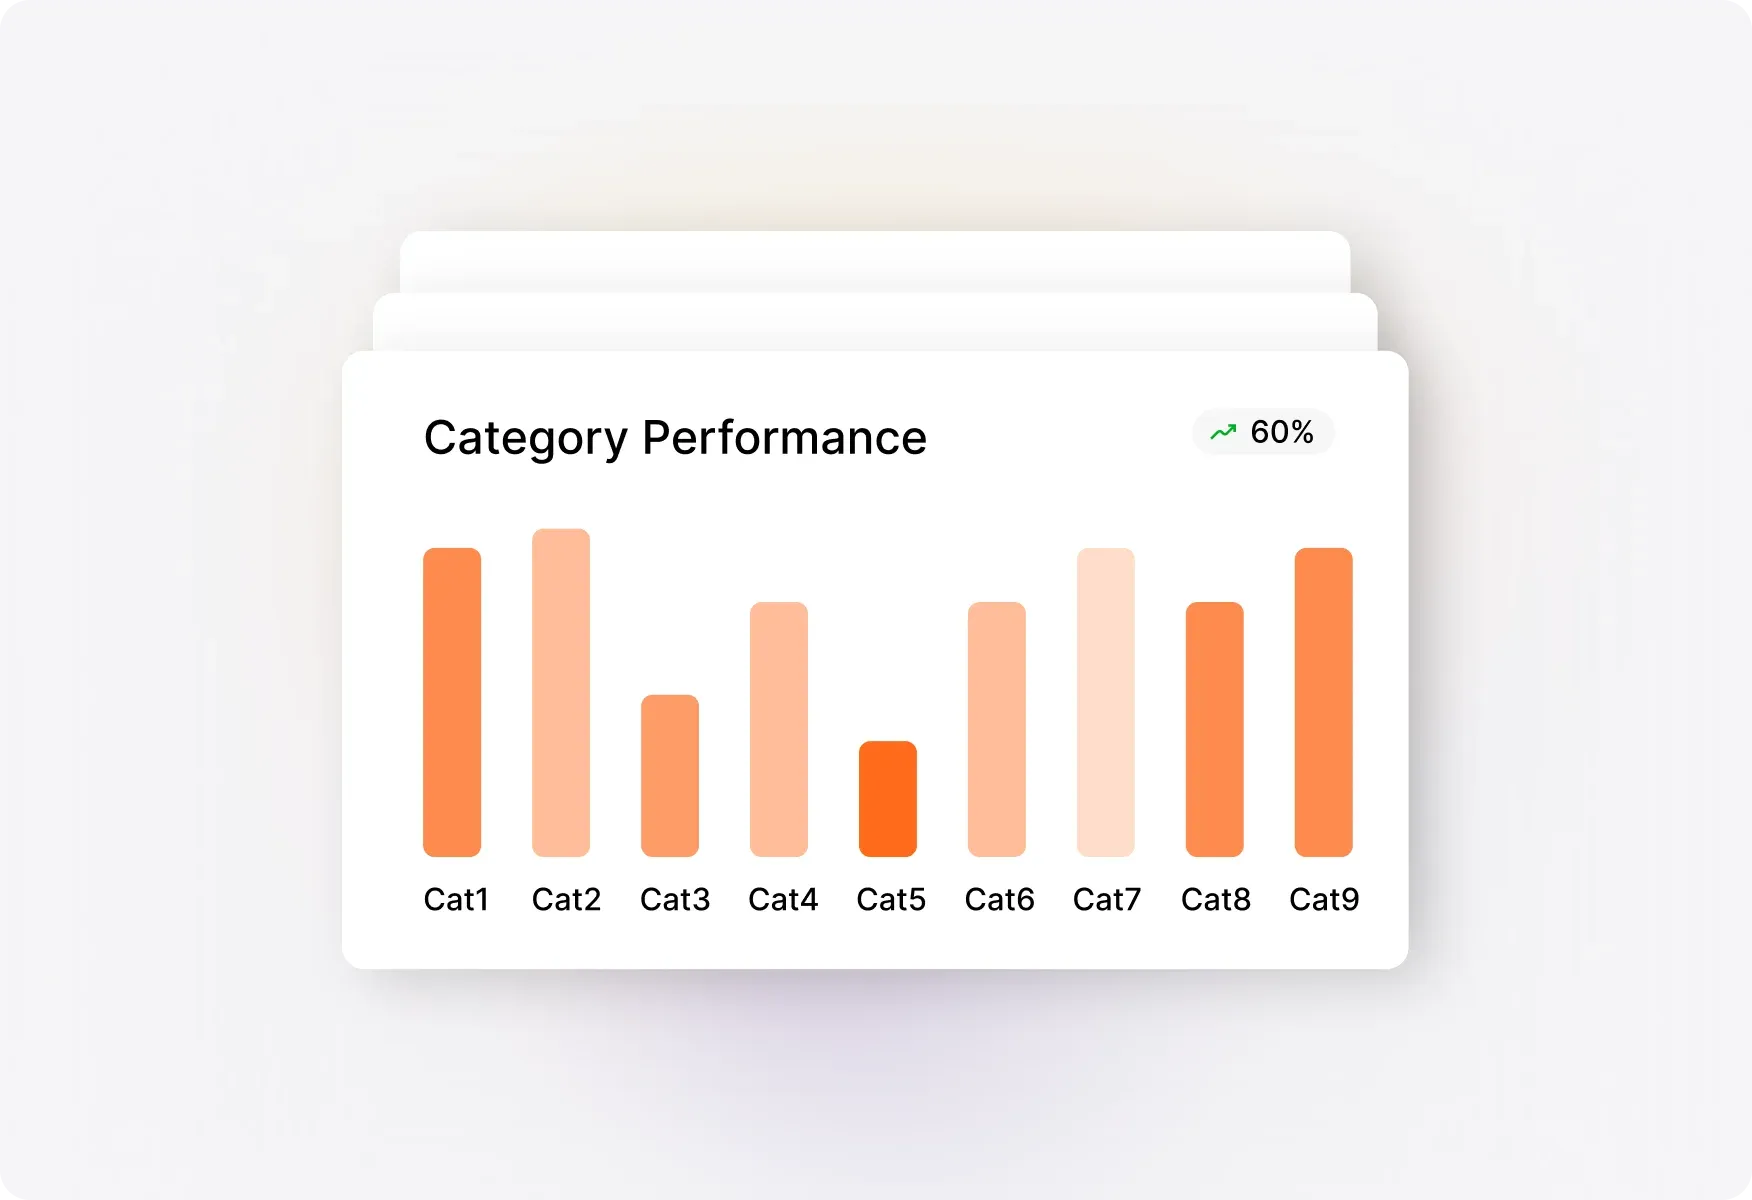
Deep Dive into Category Performance
Expanded Category View
Visualize the distribution of categories across all performance metrics in a tabular format for quick comparison. Search for specific categories and sort by any metric to find the highest or lowest values. Supports up to 100 categories.
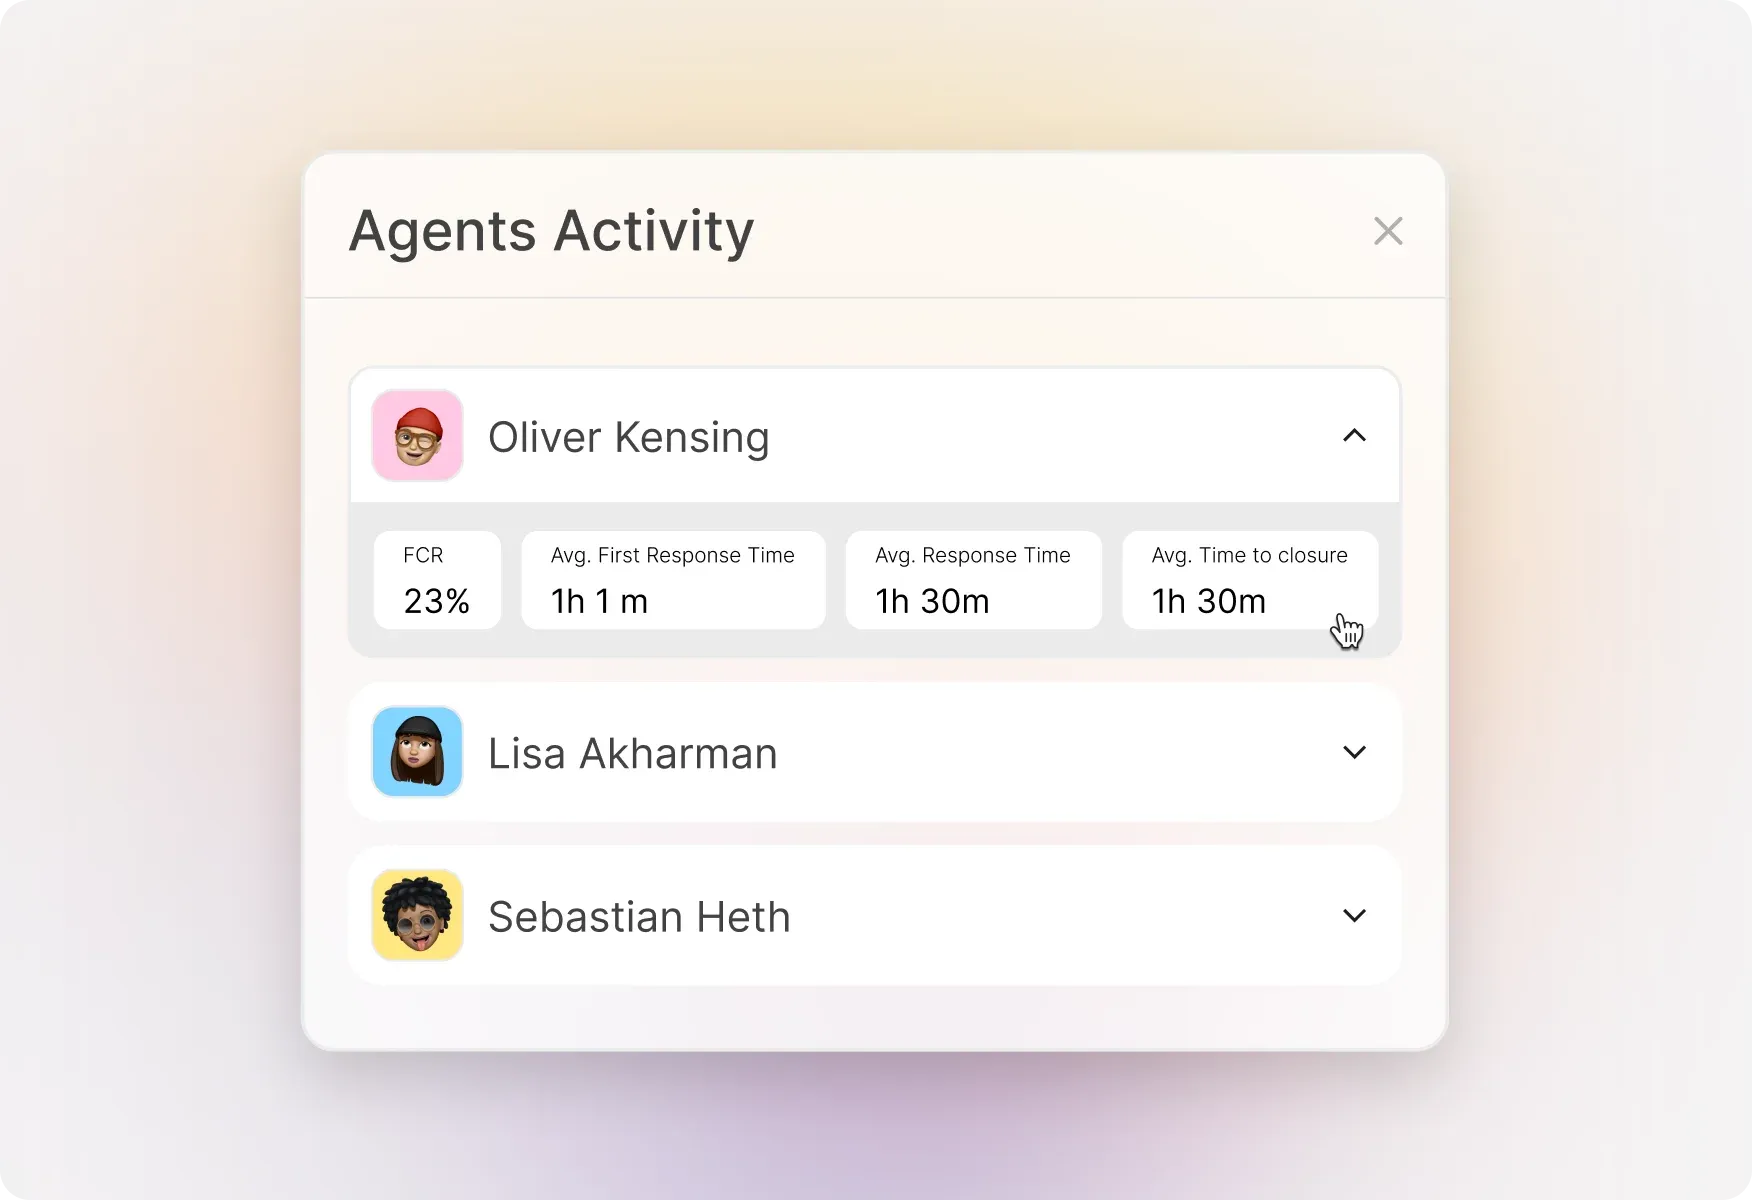
Detailed Agent Performance Analysis
Expanded Agent View
Compare agents side-by-side across FCR, average first response time, average response time, average time to closure, average responses, and average responses to closure. Search for specific agents and sort to identify performance patterns. Supports up to 200 agents.
Explore Other HappyFox Reporting Features
Frequently Asked Questions
Turn Performance Data into Better Support
Stop guessing and start measuring. Get the insights you need to coach your team, optimize workflows, and deliver faster resolutions.

Use Cases
For Business Type
For Industries


Copyright ©2026 HappyFox Inc. All rights reserved.