


See Your Automation in Action. Optimize What Works.


Are Your Automations Actually Working?
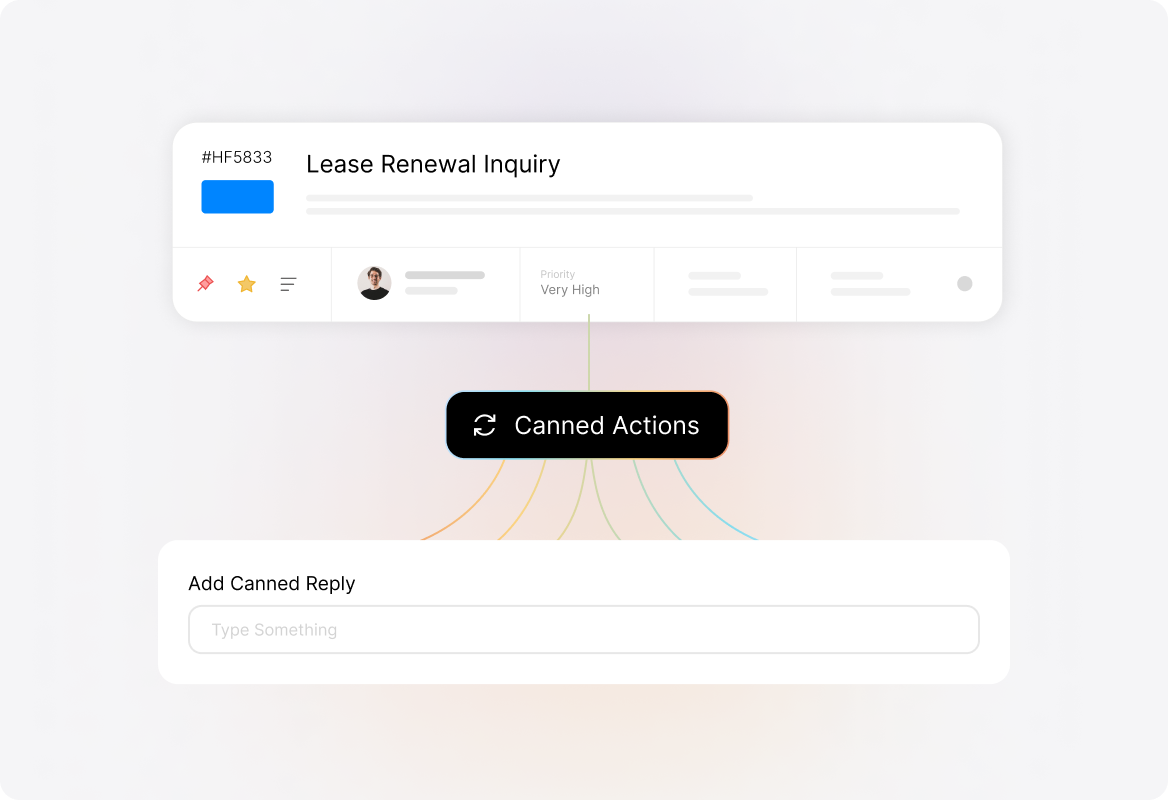
You've set up Smart Rules to automate your support workflows—but how do you know they're performing? Without visibility into automation activity, you're flying blind. Smart Rules Report puts the data in your hands, helping you monitor which rules are firing, how often they trigger, and which tickets they're impacting. Make informed decisions to continuously improve your automation strategy.
Key Automation Statistics at a Glance
The Smart rules report summary gives you instant insight into your automation performance.
Rules Triggered
See the count of smart rules triggered at least once during your selected time-frame
Total Fires
Track how many times your smart rules fired across all tickets
Tickets Applied
Monitor how many tickets had at least one smart rule trigger
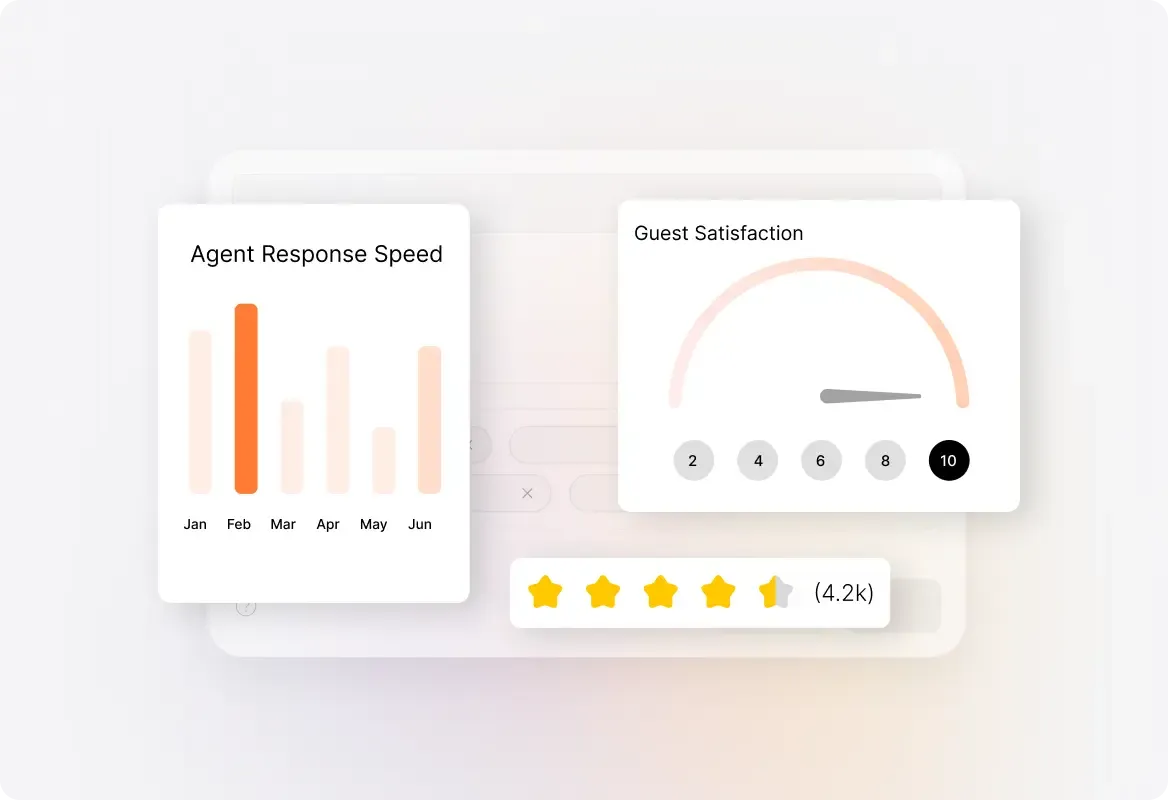
Powerful Analytics for Your Automation
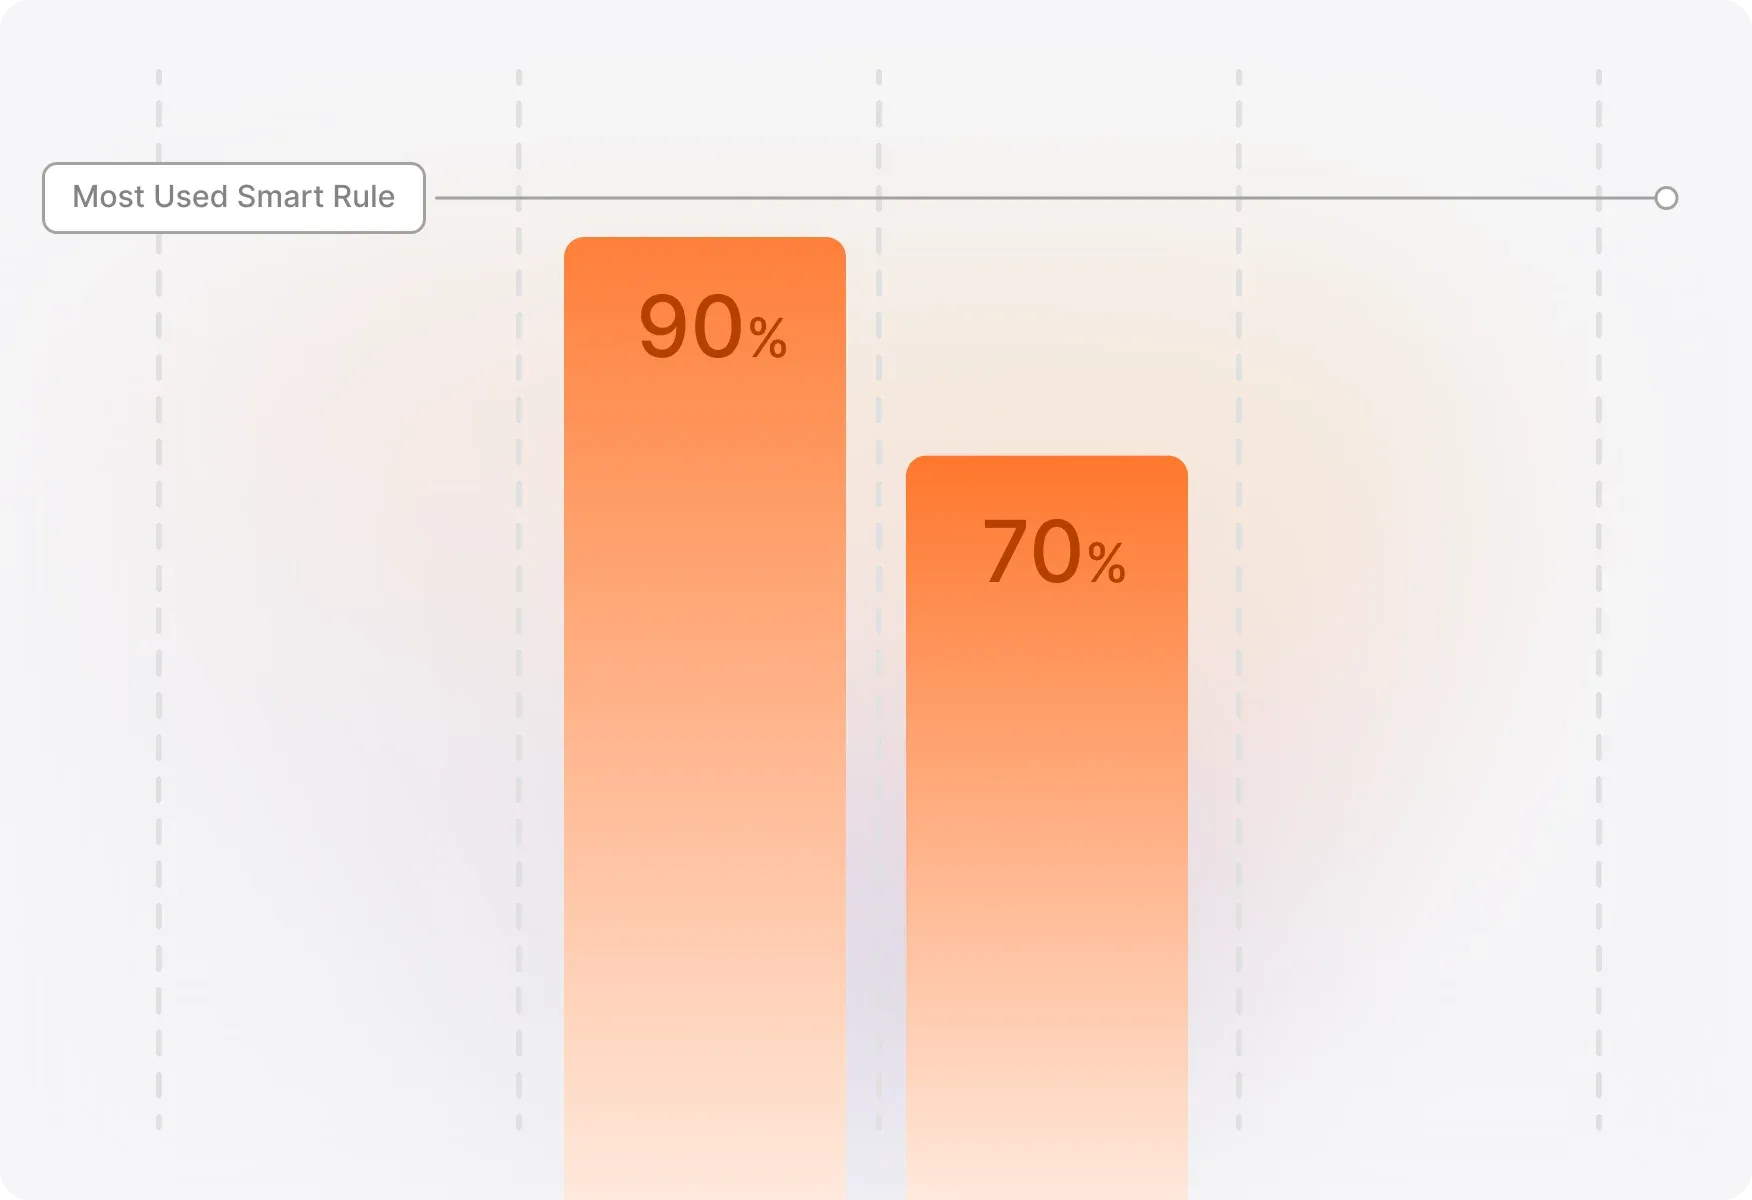
By Smart Rule: Individual Performance Analysis
Dive deep into each smart rule's performance. View distribution across two key metrics: Times Triggered and Tickets Applied. This side-by-side comparison helps you quickly identify which rules are most active and spot high-frequency automation patterns.

By Smart Rule - Relative: Compare and Benchmark
Quickly compare one metric's value relative to another and identify which smart rules have a high Times Triggered to Tickets Applied ratio - revealing rules that fire repeatedly on the same tickets.
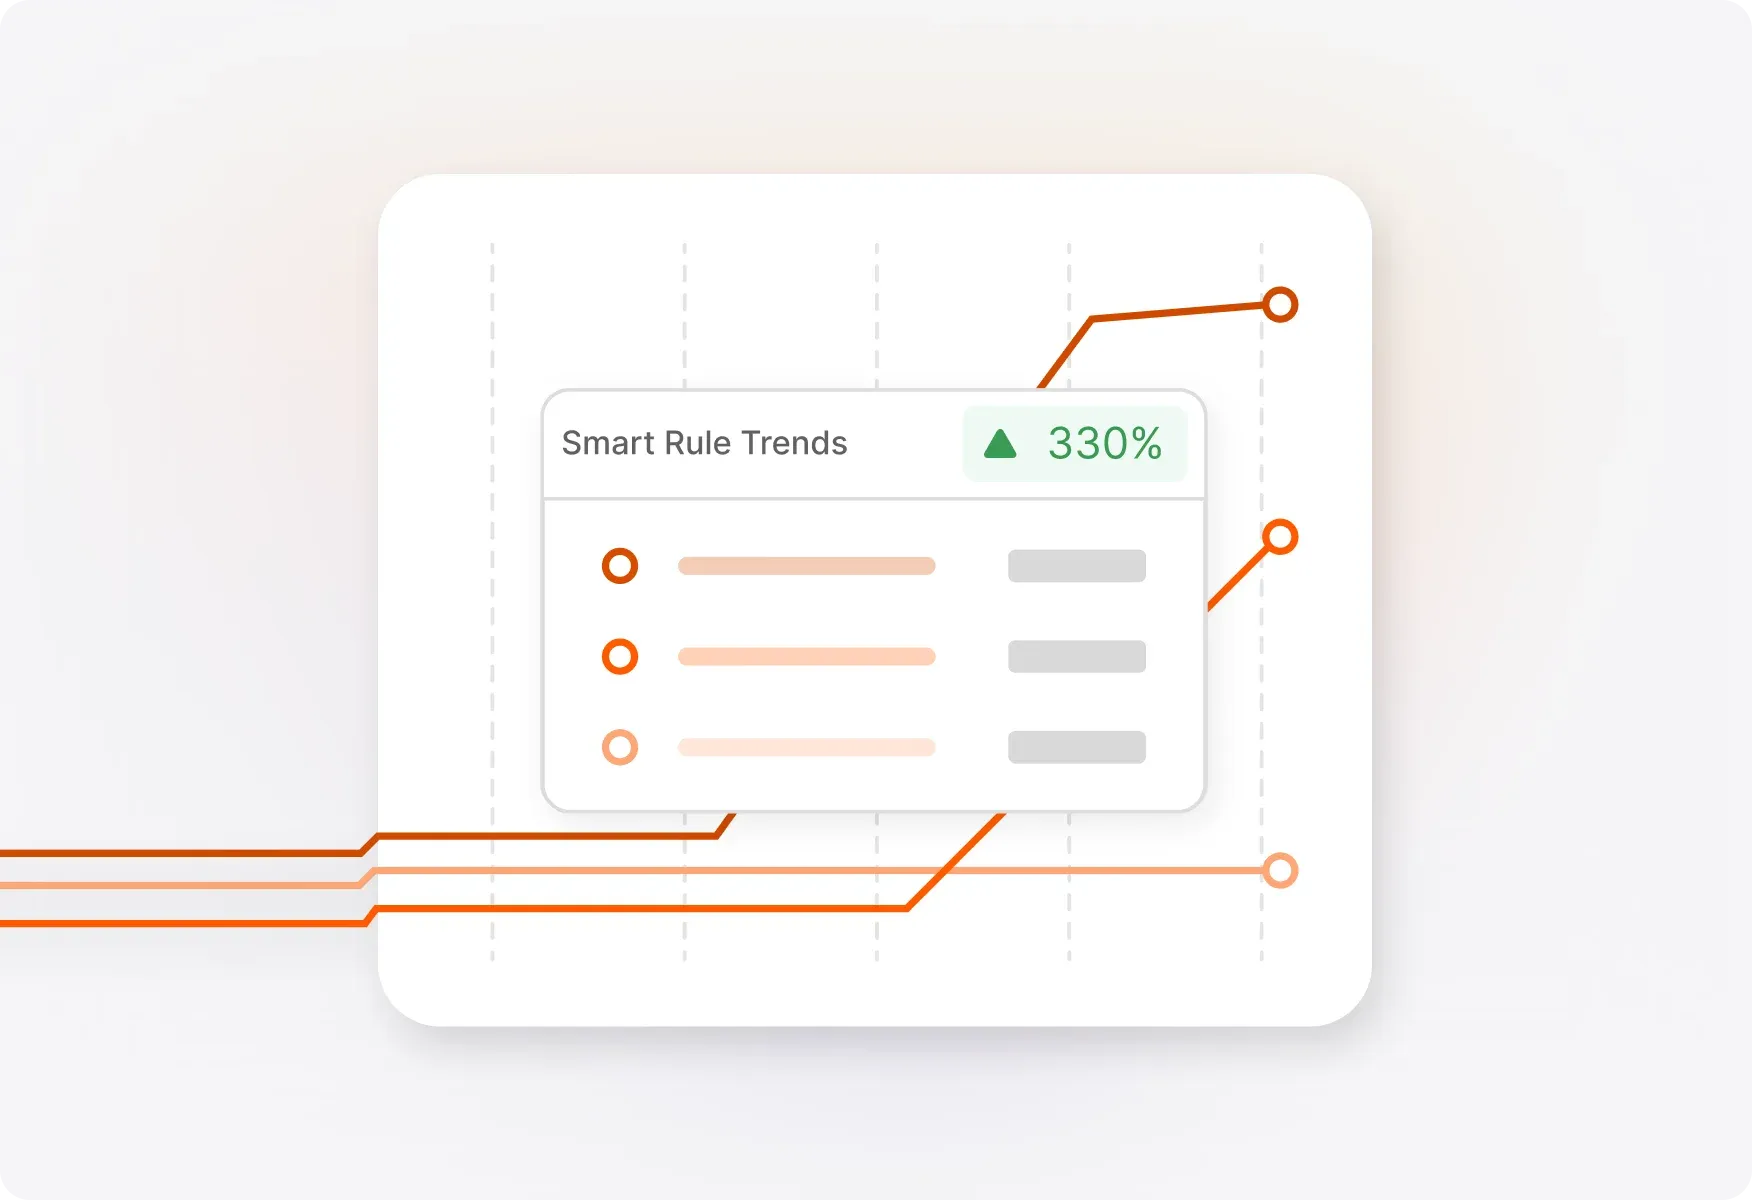
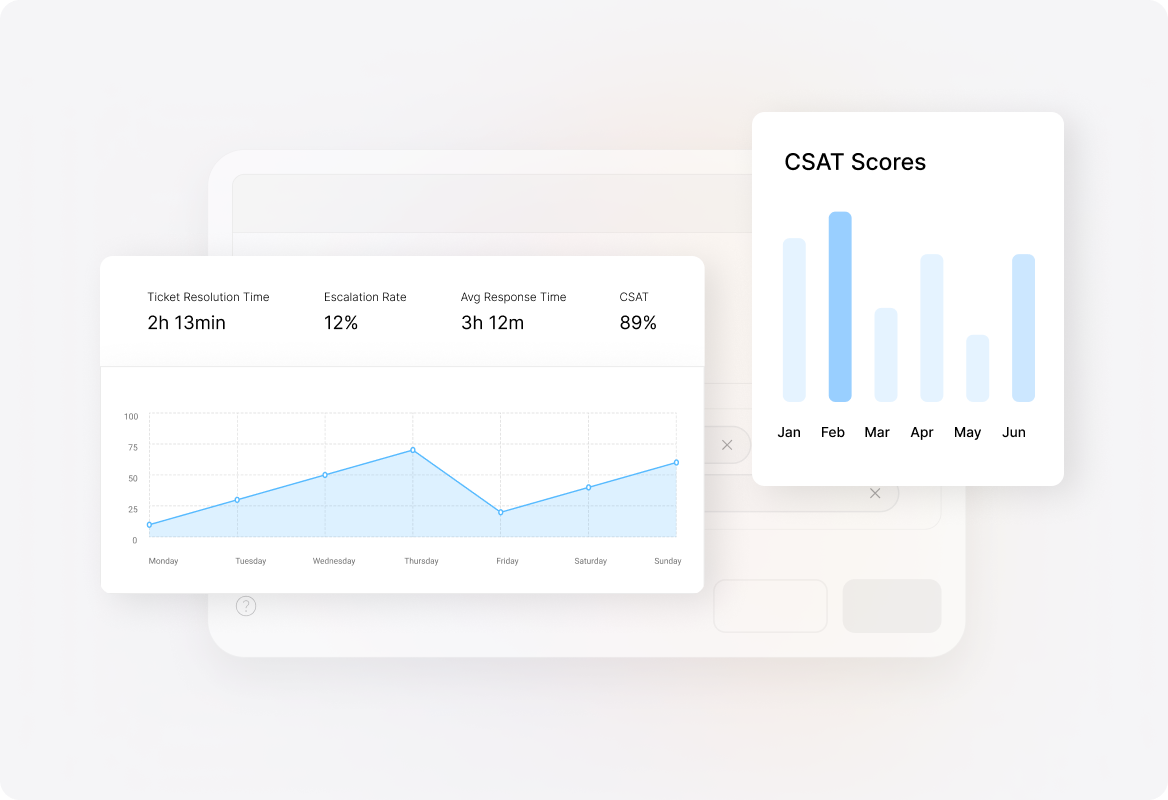
Smart Rule Metrics Across Time: Visualize Trends
Track automation activity over time with flexible visualization options: Timeline Table, Heatmap, and Line Graph to track trends and benchmark one Smart Rule against another. Refine your view by hour, day, month, quarter, or year to identify patterns and optimize your automation timing.
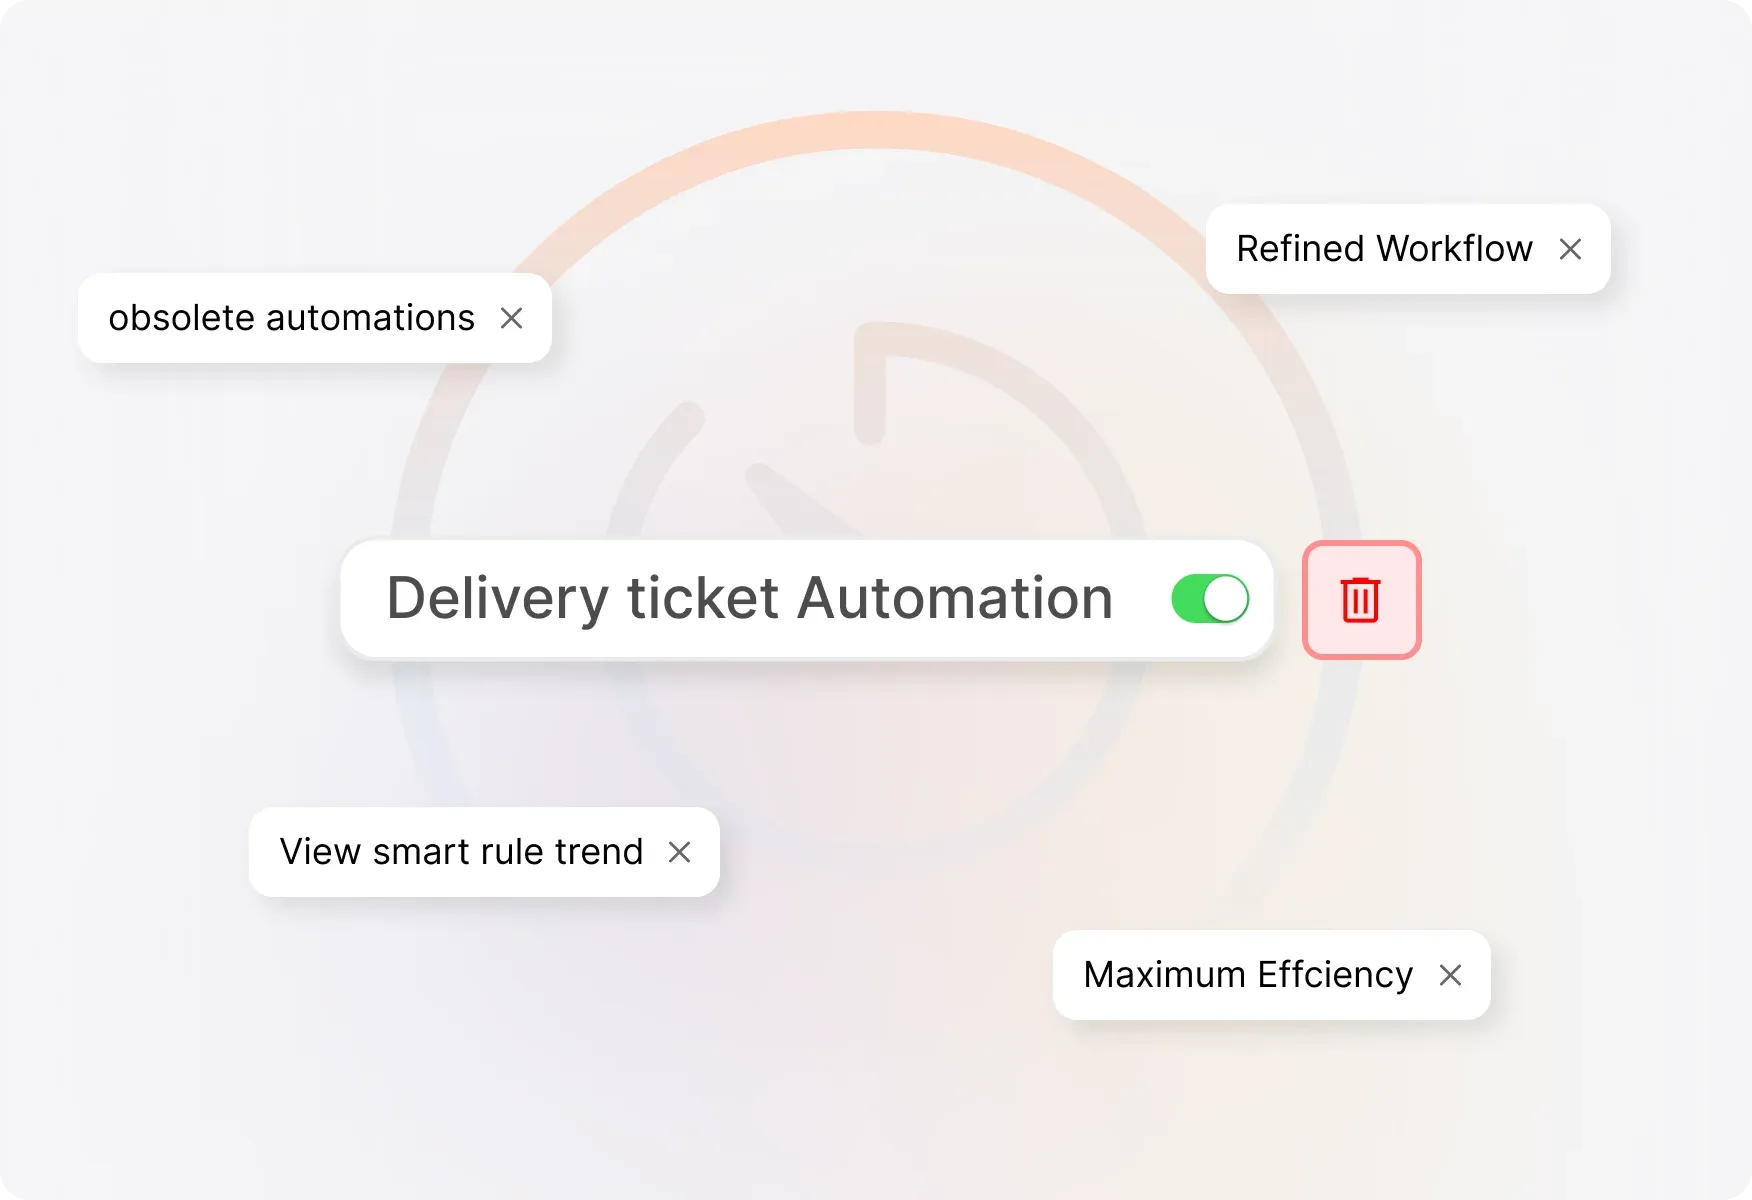
Track Deleted & Disabled Rules
Deleted Smart rules still count in your report statistics—as long as they had at least one trigger during your selected time-frame. Plus, you can view the count of active, disabled, and deleted smart rules right from the Smart Rules overview tab.
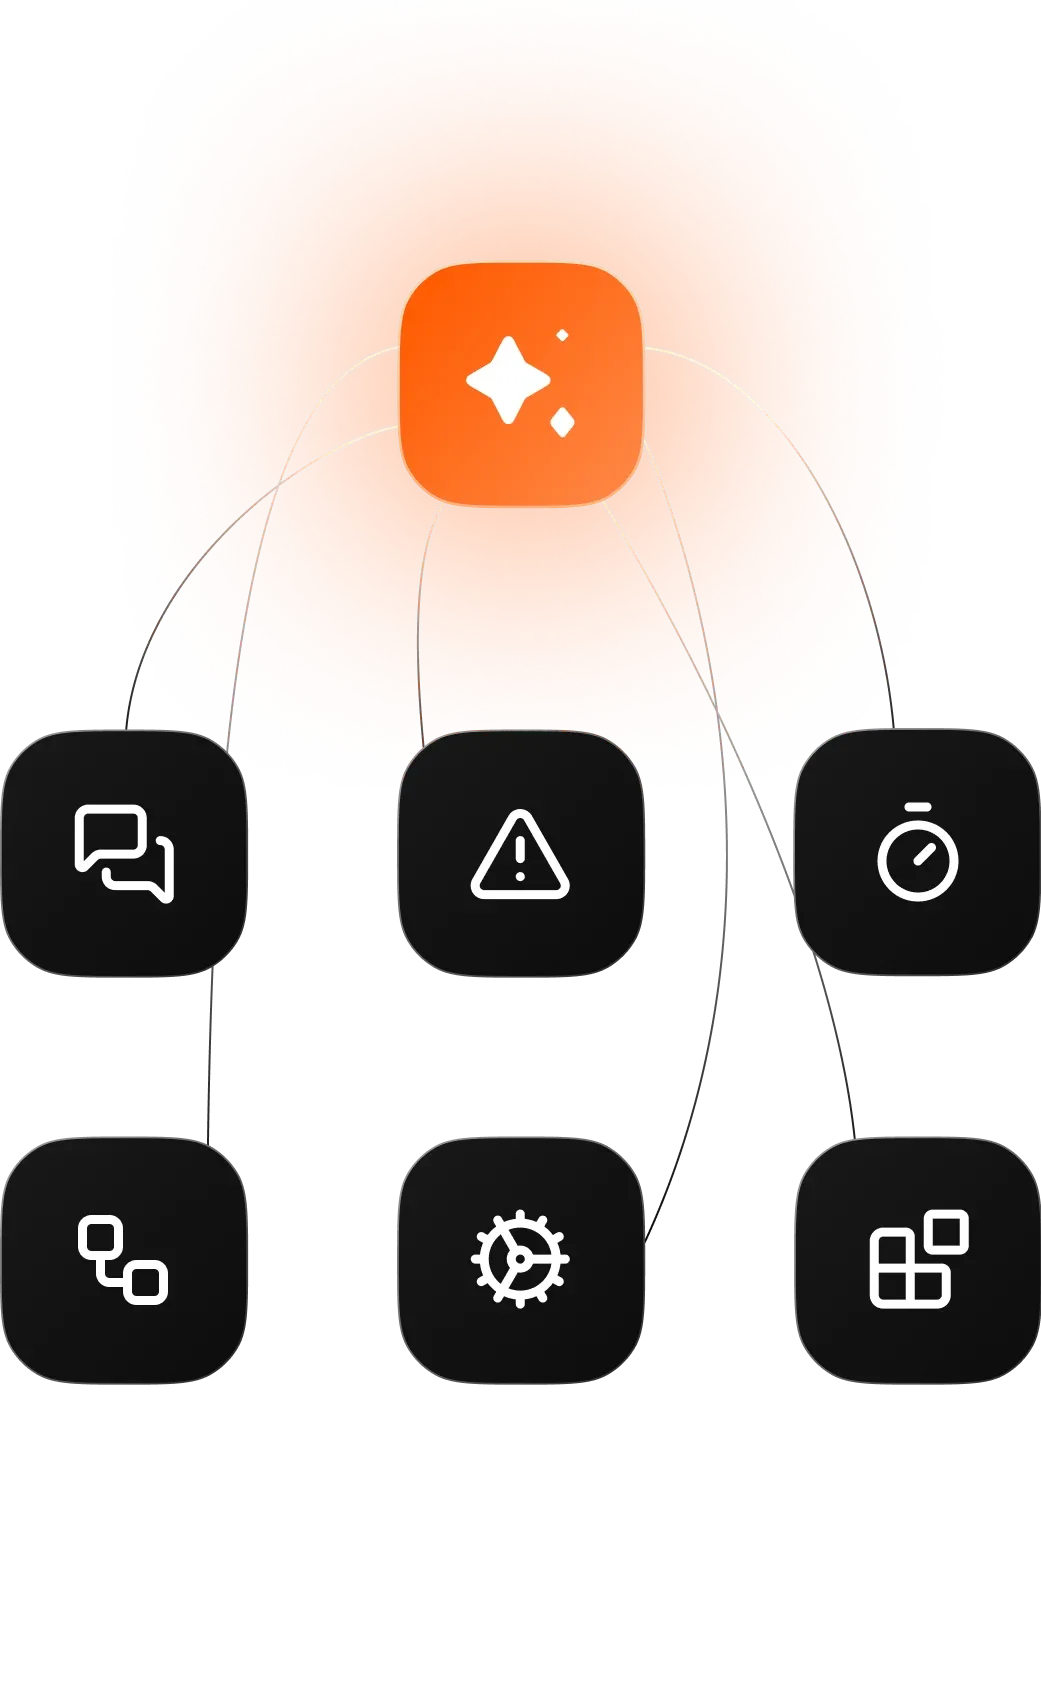
Explore Other Features of HappyFox
FAQs
Ready to Optimize Your Support Automation?
See exactly how your Smart Rules are performing and make data-driven improvements to your support workflows.

Use Cases
For Business Type
For Industries


Copyright ©2026 HappyFox Inc. All rights reserved.